Calculate building height statistics
All raster tutorials · Vector Raster plugin
Calculate mean, minimum and maximum normalised height for buildings only, using the fixed local crop of the 2019 nDSM.
Before you begin
Set up the complete raster project. Tested on 3 October 2026, Apache Hop 2.19.0, Java 21.0.10, with the plugin builds recorded in the ZIP’s tested-environment.json. Use the local run configuration.
Complete project ZIP. Individual pipelines need the data and metadata from that ZIP.
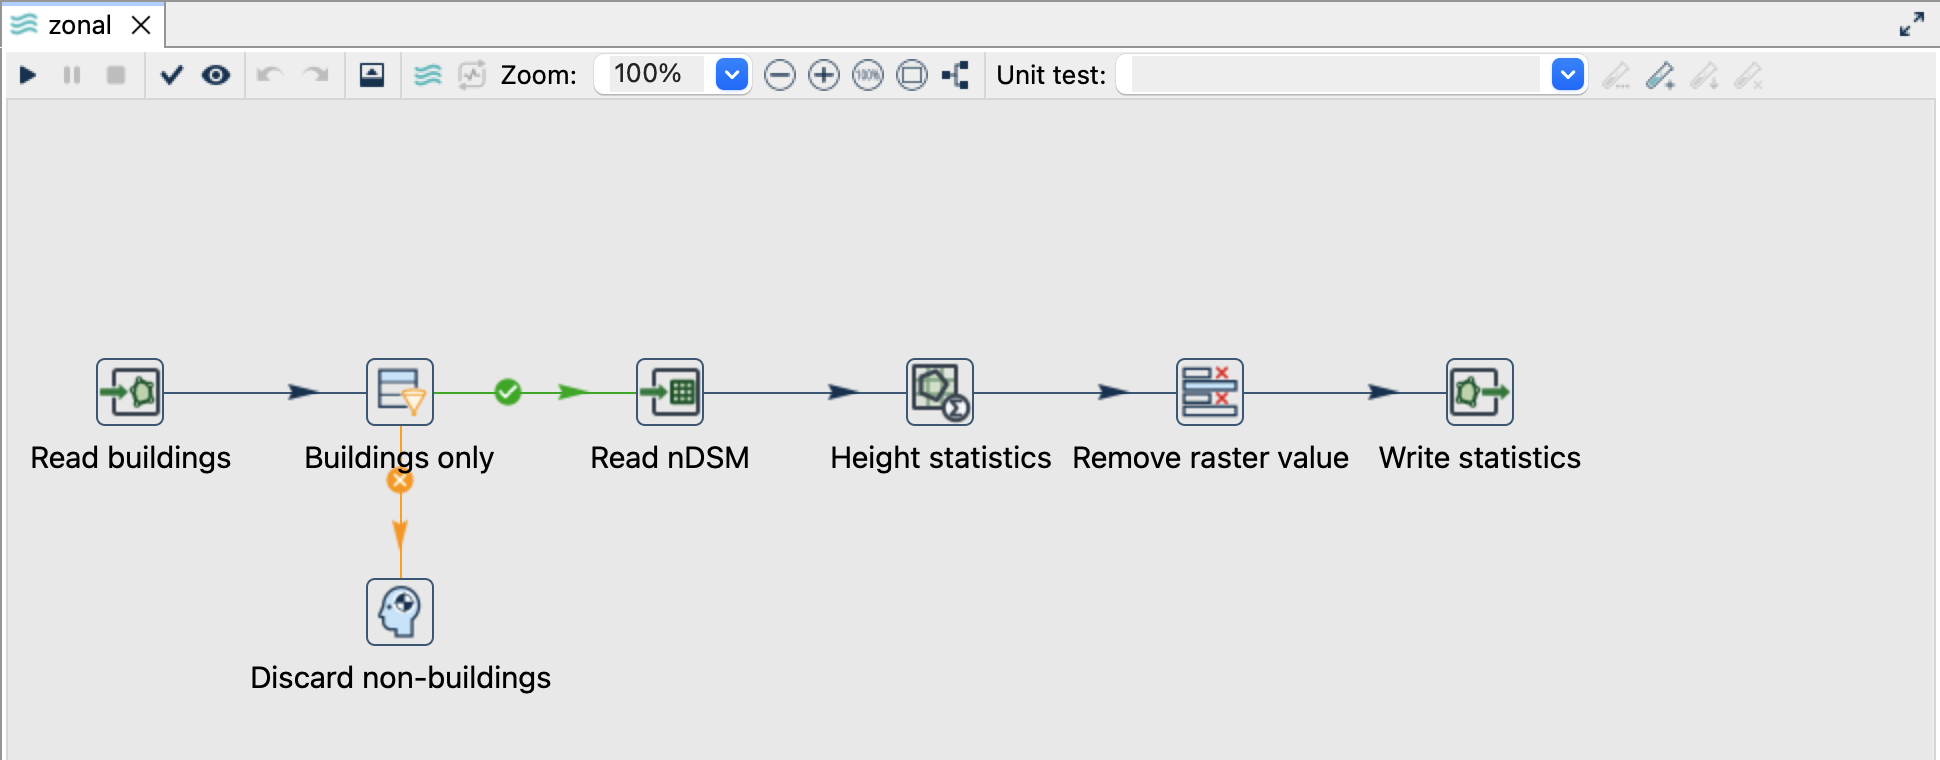
Follow the pipeline
- Open
zonal.hpl. Read buildings reads${PROJECT_HOME}/data/buildings.gpkg, layerbuildings, geometry fieldgeometrie. - Buildings only checks
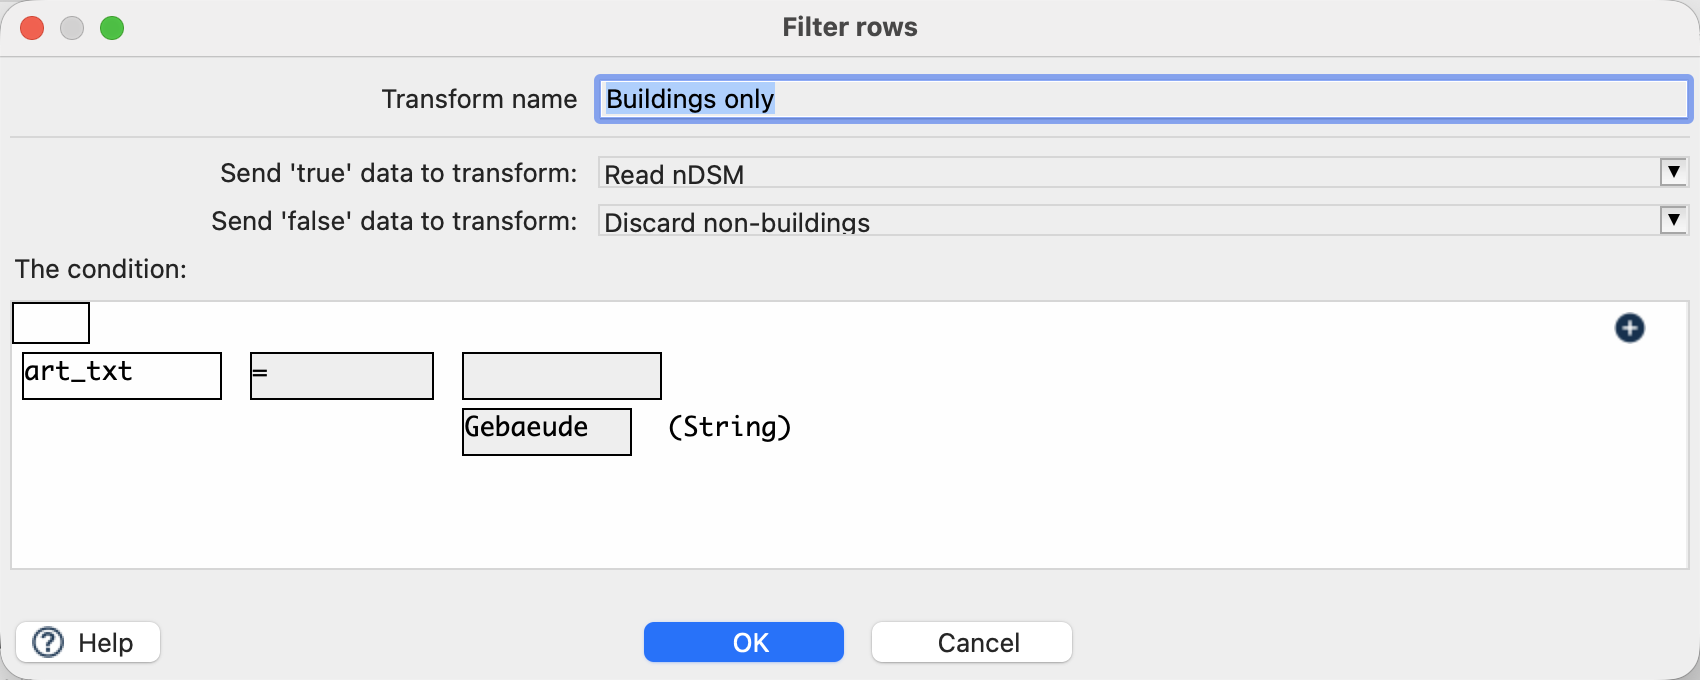
art_txt = Gebaeude; its false branch discards non-building rows. The input file already contains only buildings. - Read nDSM adds
${PROJECT_HOME}/data/ndsm-2019.tifasrasterto each row. There is no preceding reprojection or resampling. - Height statistics reads the raster and the corresponding footprint.
- Remove raster value removes
rasterwhile keeping attributes, geometry and statistics. Write statistics creates${PROJECT_HOME}/output/zonal.gpkg, layerbuilding_heights.
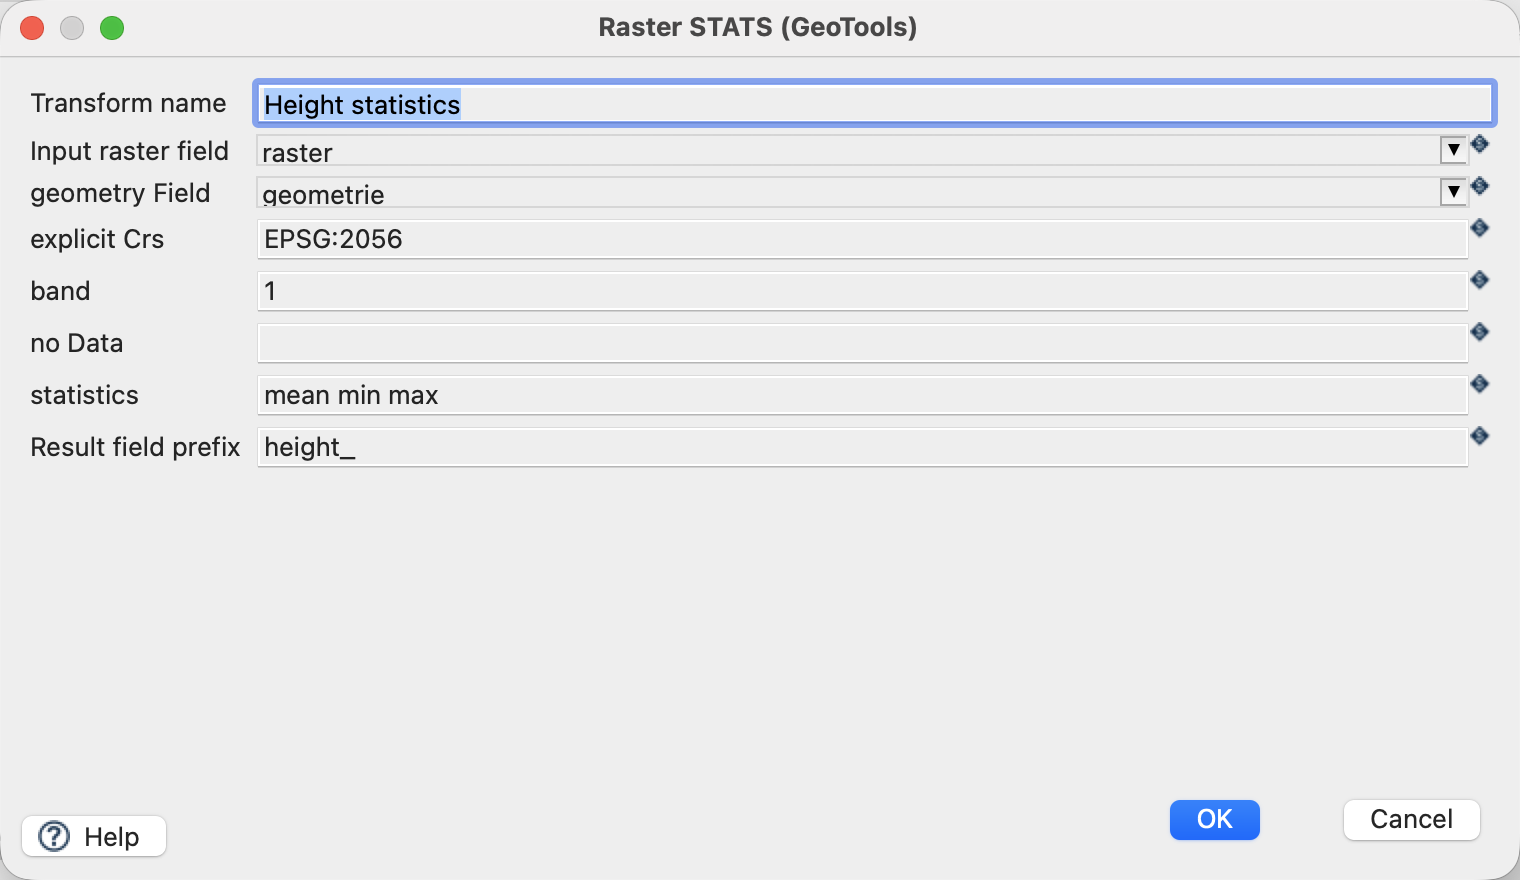
Configure ZonalStats
| Setting | Value |
|---|---|
| Input raster field | raster |
| Geometry field / explicit CRS | geometrie / EPSG:2056 |
| Band | 1 |
| Statistics | mean min max |
| Prefix | height_ |
| NoData override | Empty: source declares -9999 |
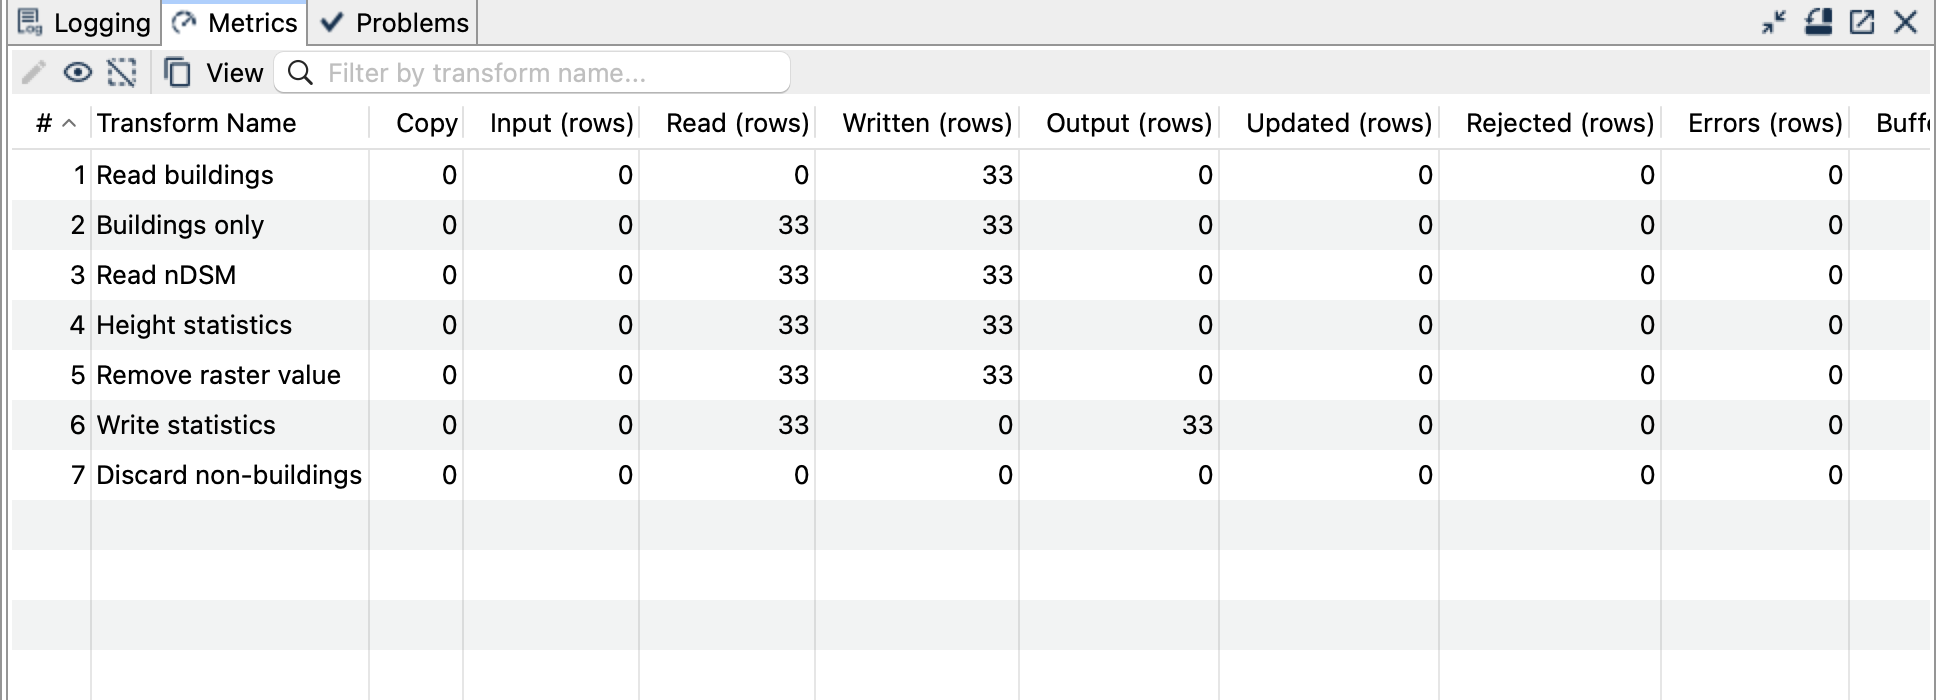
Run and inspect the result
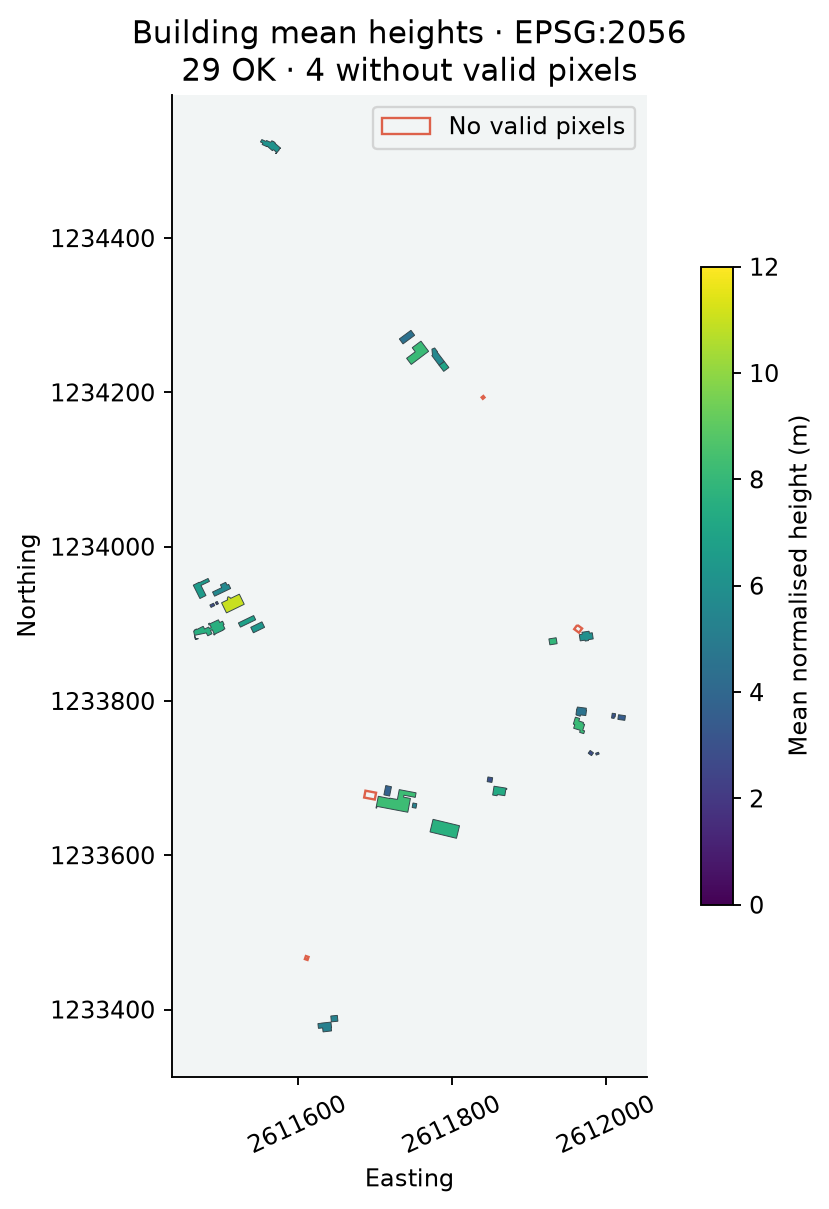
Expect 33 building polygons with original attributes and building_id, plus height_mean, height_min, height_max, height_count and height_status. The writer may allocate its own storage feature IDs; use building_id or T_Ili_Tid for matching records.
For the bundled snapshot, 29 buildings are OK and four have NO_VALID_PIXELS. Example independently checked records:
| building_id | count | mean (m) | min (m) | max (m) | status |
|---|---|---|---|---|---|
| 15 | 0 | null | null | null | NO_VALID_PIXELS |
| 16 | 2717 | 5.637887 | 0.383500 | 7.887500 | OK |
| 17 | 3570 | 6.543541 | 2.833000 | 9.418750 | OK |
| 20 | 12603 | 8.220402 | 3.047500 | 13.105294 | OK |
Things to watch out for
- A pixel contributes when its centre is covered by the polygon, including centres on the boundary. This is not ALL_TOUCHED or an area-weighted statistic.
- NoData, masked and non-finite samples are excluded; a valid zero is included.
- The current footprints and the 2019 acquisition can disagree. Null statistics are an explicit result, not a technical failure or an assumed zero height.
- The output describes nDSM samples inside a footprint, not an exact building or roof height.
- Keep the typed Raster field away from Vector Writer by removing it with Select Values.
- Rerunning must use a fresh destination or remove only the generated
zonal.gpkg.